To mark World Statistics Day, the Normandy Index shows how comparable data can help policymakers identify risks, understand the connections between them, and better target their actions. Its latest edition highlights, in particular, Russia’s decline and the European Union’s persistent energy vulnerability.
Statistics are not an end in themselves. For a public decision-maker, they are a means of forecasting, making systematic comparisons, and determining where to take action. This is particularly true when it comes to peace and security. A war is not confined to the territory where it breaks out: it can disrupt energy and food prices, trade, public finances, migration, and the political balance of power. To understand these effects, one must look beyond the events themselves.
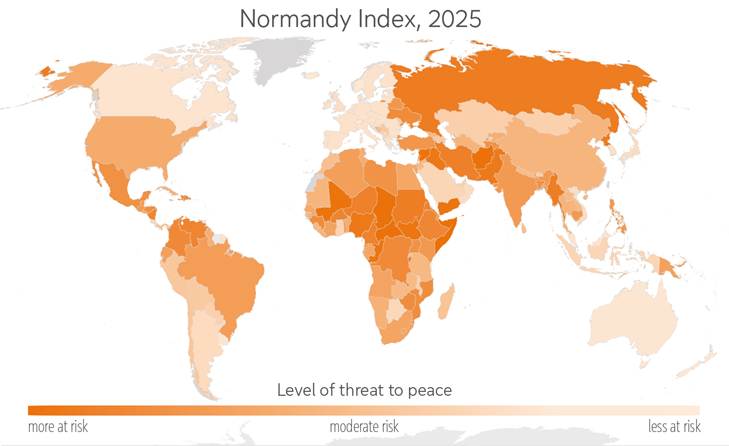
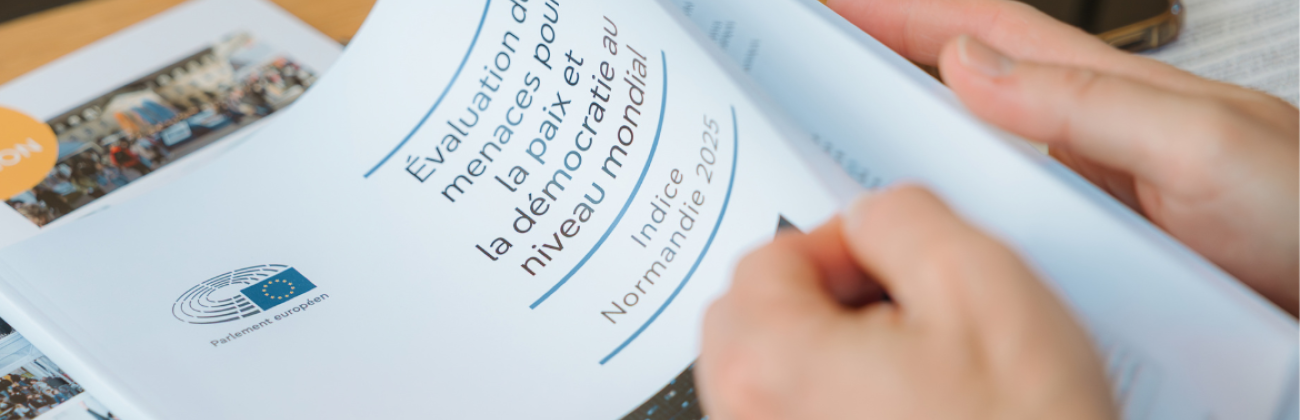
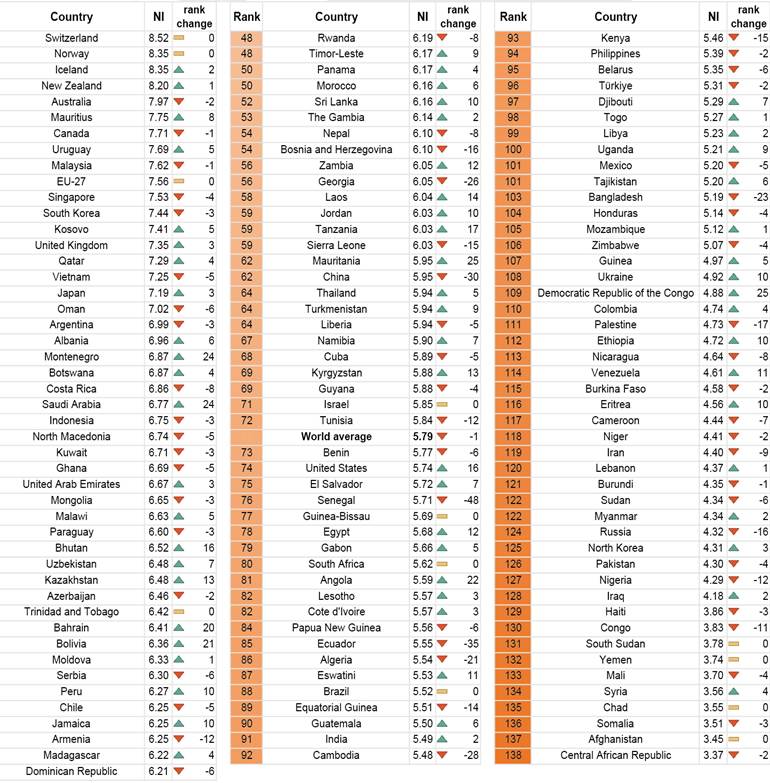
This is the goal of the Normandy Index, developed by the European Parliament Research Service (EPRS) in partnership with the Normandy Region and using data from the Institute for Economics and Peace. Since 2019, it has provided an annual snapshot of the threats to peace and democracy. The 2025 edition, published in January 2026 and based on data available at the end of 2025, concludes that the global threat level is the highest observed since the tool was launched. It highlights a general deterioration: the global average score stands at 5.79, up from 5.74 in 2023–2024, on a scale where lower values indicate greater exposure to risks and where 10 is the best score.
Why an index for policymakers?
No single figure can capture the full reality of a country. But a coherent set of indicators can reveal trends and highlight vulnerabilities. It can help compare situations over time and across regions. Composite indices thus serve as benchmarks and early warning systems: they organize information and can highlight areas that warrant further analysis. They do not automatically predict war, nor do they replace expertise or political judgment.
The Normandy Index addresses a concrete need in the European Union’s foreign policy. It translates the threats identified in the EU’s Global Strategy and Strategic Compass into measurable indicators. It is not intended to award medals to “peaceful” countries, but rather to identify risks and better understand resilience needs. It provides an empirical basis for debates within the European Parliament and with its institutional partners, enabling greater democratic oversight of external action priorities.
How do we construct it?
The 2025 edition compares 137 countries and the EU-27, which is treated as a separate entity. It tracks eleven dimensions of risk to peace, drawing on nine of the eleven threats identified by the Union’s comprehensive strategy (terrorism, hybrid threats, economic crises, energy insecurity, violent conflicts, climate change, cybersecurity, fragile states, disinformation, and weapons of mass destruction). In the absence of consistent global data on cross-border crime, crime is estimated based on homicide rates and measures of public perception of crime. Hybrid threats—because they combine multiple phenomena—are assessed through their various components rather than through a single metric. The index also incorporates threats to democracy, as the quality of democratic processes is a central dimension of European external action.
For each area, the EPRS selects one or more representative indicators, chosen from official and academic studies and based on data availability. Sources include, among others, the United Nations, the World Bank, the International Monetary Fund, the International Telecommunication Union, Varieties of Democracy (V-Dem), and the Institute for Economics and Peace. Some areas are based on composite indicators specifically designed for the Normandy Index, particularly to measure energy insecurity, the economic crisis, and crime.
The results are converted to a common scale: for each dimension, a score of 10 corresponds to the absence of the measured risk, and a score of 0 corresponds to a serious threat. The domains are weighted equally in the final result. Each category carries equal weight in the final result. This rule makes the calculation transparent and prevents any single type of threat from automatically dominating the overall assessment. However, it does not eliminate methodological choices: the selection of indicators, the varying quality of data, and publication timelines all influence what can be observed. The ranking should therefore be interpreted in light of the detailed country profiles, annual trends, and accompanying case studies, and not in isolation.
What the Numbers Say About the War in Ukraine, Russia, and Energy
The war of aggression against Ukraine, the multiple crises in the Middle East, geopolitical rivalry, militarization, and hybrid threats are contributing to the erosion of global peace, which also has repercussions for the European Union’s energy security.
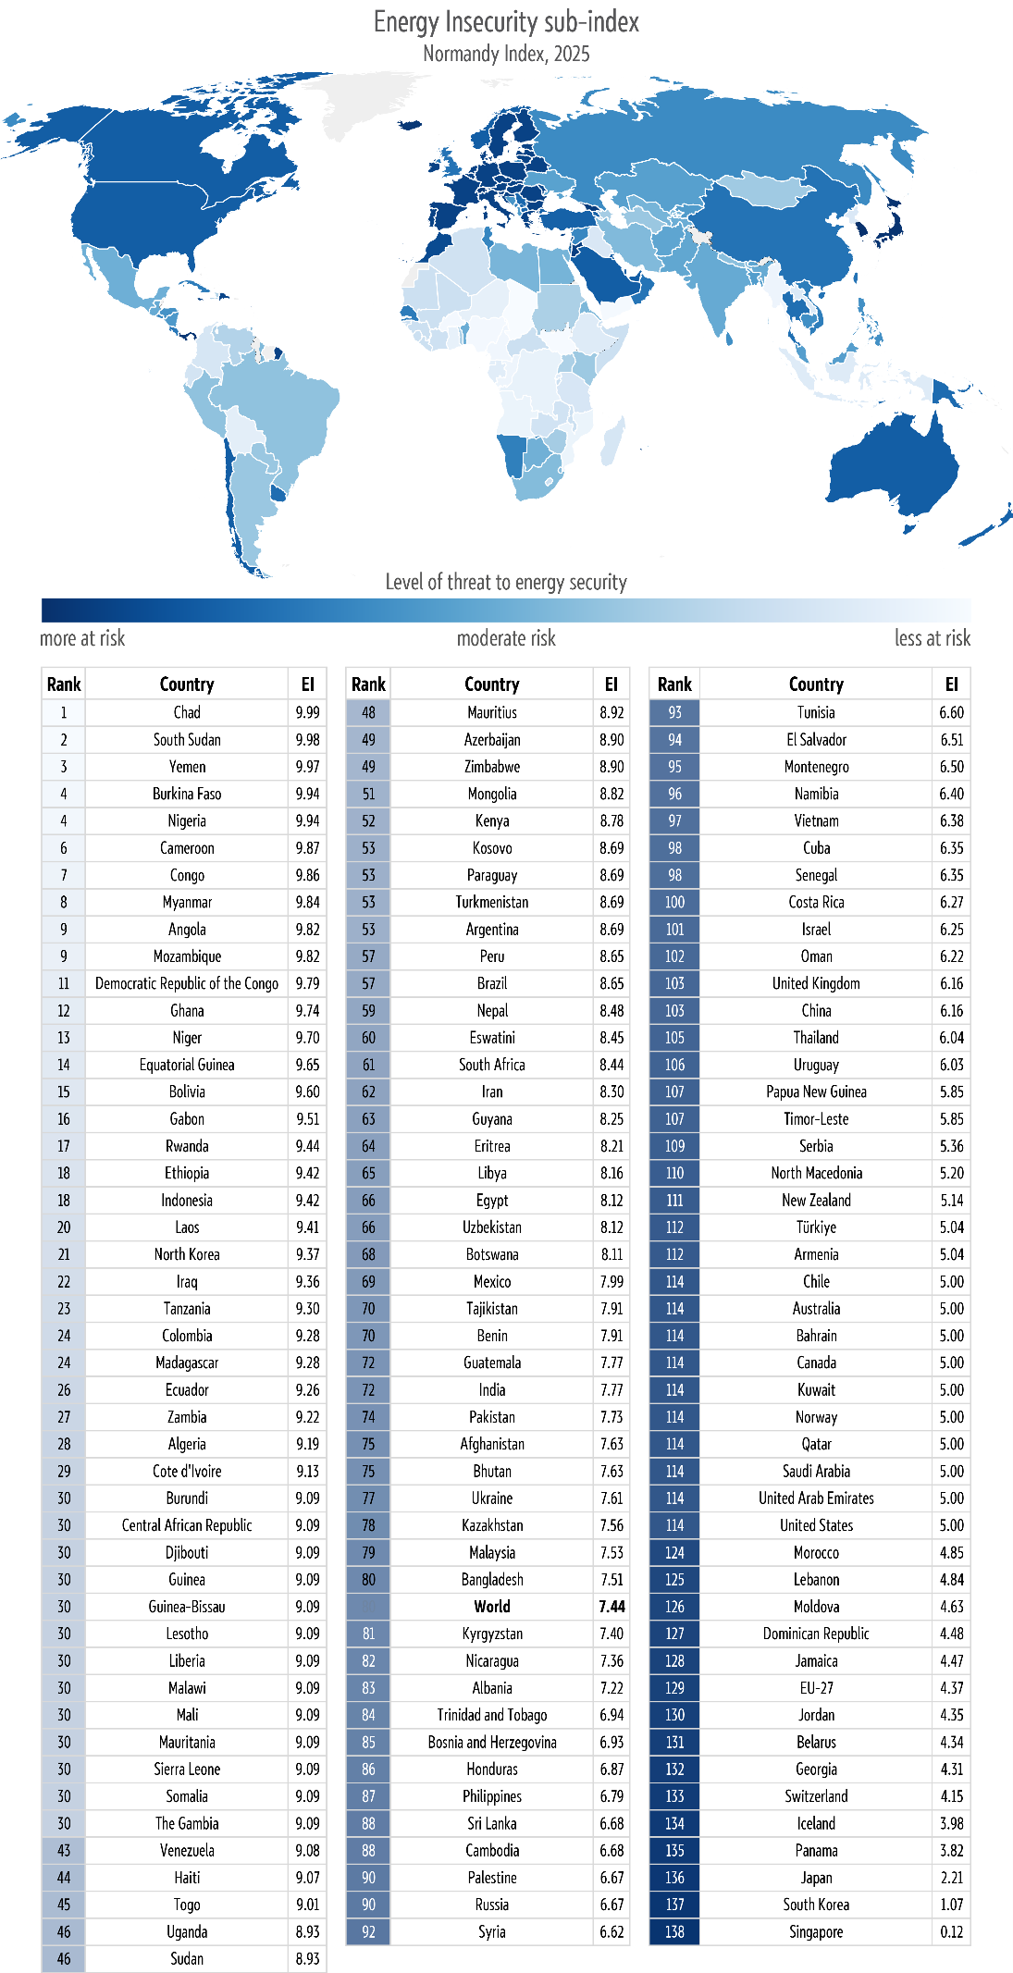
The Russian Federation fell 16 places in 2025, landing in 124th place. The study attributes this decline to a weakened resilience caused by unfavorable economic conditions and uncertainty stemming from the war in Ukraine. The effects of sanctions and internal difficulties are becoming more pronounced as the war drags on. Energy indicators provide concrete insight: Russia’s export revenues from oil and refined products fell sharply in the fall of 2025, driven by a combination of declining volumes and prices. While this indicator alone does not fully capture Russia’s situation, it helps link developments in the energy sector to budgetary constraints and the state’s ability to sustain its war effort. The index thus encourages us to look beyond a purely military interpretation of the conflict.
Energy also sheds light on the situation in Europe. In the overall ranking, the EU-27 remains in 10th place globally, but is more vulnerable to energy insecurity than the global average, ranking 129th worldwide in this category. The invasion of Ukraine, along with the war in Iran and the Middle East, have contributed to the overall decline in the global score in this dimension, underscoring that dependence on supplies and infrastructure, as well as energy policy choices, have direct consequences for security. A single crisis thus links several areas: energy, the economy, trade, and political resilience.
A Tool for Better Policy Decisions
The value of an index lies not only in its final ranking. The interactive version allows users to compare countries, regions, time periods, and specific threats. Case studies supplement the statistical data with national context, emerging sources of insecurity, and forms of European support. A finding may thus lead us to ask why a country has made progress, what vulnerabilities remain, or which policy tool—at the European or national level—would be most appropriate.
Celebrating statistics also means recognizing the conditions under which they are produced and their limitations. This requires verifiable sources and a consistent methodology, as well as explicit definitions and a careful reading of the context. The numbers do not make decisions in place of public officials. However, they can reduce blind spots, challenge assumptions, and make decisions more transparent. In a world where threats reinforce one another, having a common and understandable metric is already a step toward taking action.
A new edition of the Normandy Index will be available in early 2027.
Eric Pichon and Branislav Staníček,
European Parliament Research Service